

NAPLAN results
The results of NAPLAN tests show how children are performing in reading, writing, and numeracy. The NAPLAN test results are intended to support teaching and learning improvements. The data from NAPLAN test results help schools and the government to compare students’ accomplishments to national minimum standards. Insights into student performance in other states and territories are also provided through the data from NAPLAN test results.
Key points on the importance of NAPLAN Results:
- Checks the reading and numeracy skills of the students.
- Examines students’ performance in relation to the National Minimum Standards.
- Compare the performances of states and territories.
NAPLAN Results 2022: Top-Performing Schools Revealed!
The best-performing schools are revealed as NAPLAN 2022 result is out! Know about the schools that performed the best in NAPLAN 2022.
Results are given for the top primary and secondary 5 best-performing schools in all states and their results.
New South Wales
Top 5 Primary Schools
| Sydney Grammar School | Reading | Writing | Spelling | Grammar | Numeracy |
| Year 3 | 613 | 517 | 555 | 612 | 568 |
| Year 5 | 620 | 576 | 605 | 627 | 625 |
| Year 7 | 662 | 632 | 657 | 682 | 707 |
| Year 9 | 699 | 664 | 680 | 739 | 738 |
| Abbotsleigh | Reading | Writing | Spelling | Grammar | Numeracy |
| Year 3 | 556 | 505 | 516 | 565 | 482 |
| Year 5 | 597 | 584 | 598 | 593 | 579 |
| Year 7 | 628 | 630 | 644 | 646 | 664 |
| Year 9 | 664 | 649 | 657 | 687 | 685 |
| John Colet School | Reading | Writing | Spelling | Grammar | Numeracy |
| Year 3 | 532 | 468 | 476 | 532 | 498 |
| Year 5 | 587 | 556 | 577 | 614 | 576 |
| St Aloysius’ College | Reading | Writing | Spelling | Grammar | Numeracy |
| Year 3 | 544 | 486 | 513 | 551 | 508 |
| Year 5 | 587 | 550 | 582 | 572 | 581 |
| Year 7 | 634 | 593 | 627 | 623 | 668 |
| Year 9 | 662 | 640 | 642 | 675 | 689 |
| Hornsby North Public School | Reading | Writing | Spelling | Grammar | Numeracy |
| Year 3 | 539 | 494 | 517 | 560 | 489 |
| Year 5 | 574 | 562 | 590 | 586 | 576 |
Top 5 Secondary Schools
| James Ruse Agricultural High School | Reading | Writing | Spelling | Grammar | Numeracy |
| Year 7 | 694 | 667 | 711 | 743 | 766 |
| Year 9 | 725 | 684 | 720 | 751 | 774 |
| North Sydney Girls High School | Reading | Writing | Spelling | Grammar | Numeracy |
| Year 7 | 670 | 651 | 696 | 708 | 727 |
| Year 9 | 702 | 677 | 692 | 734 | 740 |
| North Sydney Boys High School | Reading | Writing | Spelling | Grammar | Numeracy |
| Year 7 | 667 | 634 | 683 | 690 | 739 |
| Year 9 | 697 | 664 | 700 | 732 | 754 |
| Baulkham Hills High School | Reading | Writing | Spelling | Grammar | Numeracy |
| Year 7 | 673 | 650 | 690 | 710 | 743 |
| Year 9 | 696 | 672 | 695 | 734 | 747 |
Victoria
Top 5 Primary Schools
| Presbyterian Ladies’ College | Reading | Writing | Spelling | Grammar | Numeracy |
| Year 3 | 548 | 506 | 525 | 594 | 491 |
| Year 5 | 591 | 579 | 597 | 637 | 588 |
| Year 7 | 622 | 618 | 637 | 658 | 664 |
| Year 9 | 660 | 646 | 649 | 687 | 684 |
| Harkaway Hills College | Reading | Writing | Spelling | Grammar | Numeracy |
| Year 3 | 504 | 484 | 469 | 505 | 434 |
| Year 5 | 587 | 600 | 575 | 646 | 554 |
| Year 7 | 626 | 659 | 609 | 629 | 585 |
| Fintona Girls’ School | Reading | Writing | Spelling | Grammar | Numeracy |
| Year 3 | 553 | 496 | 514 | 553 | 484 |
| Year 5 | 592 | 576 | 580 | 604 | 587 |
| Year 7 | 631 | 620 | 636 | 645 | 653 |
| Year 9 | 657 | 645 | 663 | 691 | 674 |
| Camberwell Grammar School | Reading | Writing | Spelling | Grammar | Numeracy |
| Year 3 | 590 | 513 | 543 | 574 | 547 |
| Year 5 | 593 | 562 | 593 | 593 | 596 |
| Year 7 | 608 | 582 | 600 | 599 | 651 |
| Year 9 | 649 | 626 | 632 | 668 | 678 |
| Camberwell Girls Grammar School | Reading | Writing | Spelling | Grammar | Numeracy |
| Year 3 | 545 | 508 | 532 | 571 | 507 |
| Year 5 | 584 | 566 | 577 | 609 | 571 |
| Year 7 | 598 | 593 | 603 | 604 | 631 |
| Year 9 | 647 | 628 | 631 | 650 | 654 |
| MacRobertson Girls High School | Reading | Writing | Spelling | Grammar | Numeracy |
| Year 9 | 688 | 669 | 683 | 724 | 715 |
| Melbourne High School | Reading | Writing | Spelling | Grammar | Numeracy |
| Year 9 | 681 | 654 | 680 | 706 | 727 |
| Nossal High School | Reading | Writing | Spelling | Grammar | Numeracy |
| Year 9 | 668 | 648 | 670 | 694 | 704 |
| Suzanne Cory High School | Reading | Writing | Spelling | Grammar | Numeracy |
| Year 9 | 668 | 651 | 666 | 696 | 696 |
| Fintona Girls’ School | Reading | Writing | Spelling | Grammar | Numeracy |
| Year 9 | 668 | 651 | 666 | 696 | 696 |
How To Access NAPLAN 2022 Results For Your School?
We understand that you are looking forward to knowing how well your school performed in NAPLAN 2022. Below we have provided you with detailed steps on how to access results from the official website.
- Step 1: Go to https://myschool.edu.au/
- Step 2: Now, enter your school name in the blank space, “Search by school name or suburb”. You can also see the results of all the schools in your suburb by entering your suburb’s name.
- Step 3: Now, you will see your school’s name or the names of all the schools in your suburb, depending on what you searched for. Here, click on “View school profile”. This will lead you to a detailed view of your school.
- Step 4: Here, click on “NAPLAN” in the navigation bar. Now, you will a drop-down menu, click on “NAPLAN results”.
- Step 5: There you go! Now, you have the NAPLAN 2022 results for your school.
How Are NAPLAN Results Reported
- Results from the NAPLAN tests are reported on scales that compare student performance to established standards.
- Results from NAPLAN are evaluated on an assessment scale for each of the areas tested at the student level. The scales are broken down into 10 bands and cover all year levels from Year 3 to Year 9. For each level of the year, not all bands are reported.
- The standards are not meant to cover the complete spectrum of what children are taught or what they might be able to do; rather, they are meant to provide a snapshot of typical achievement. The national minimum standards outline some of the skills and understanding that students can typically show in a given subject area or domain in their particular year of schooling.
- For each year i.e. years 3, 5, 7, and 9, the scales and standards system are reported.
- Results from NAPLAN are evaluated on an assessment scale for each of the areas tested at the student level. The scales are broken down into 10 bands and cover all year levels from Year 3 to Year 9. For each level of the year, not all bands are reported.
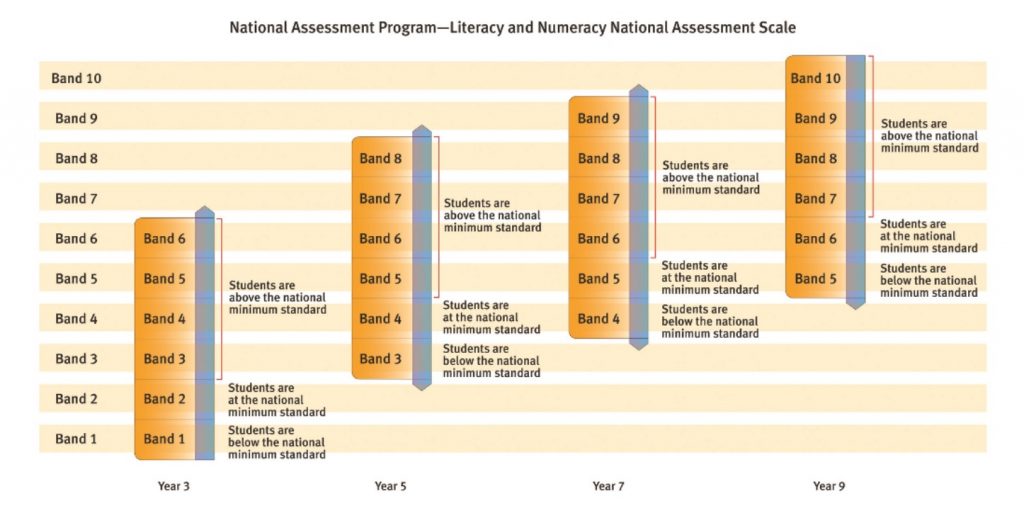
- Six bands are employed to report student performance at each year level. Bands 1 to 6 are displayed in the Year 3 report, bands 3 to 8 in the Year 5 report, bands 4 to 9 in the Year 7 report, and bands 5 to 10 in the Year 9 report.
- A national minimum standard is established and placed on the assessment scale for each year level for NAPLAN results.
- Band 2 is the minimum standard for Year 3, band 4 is the minimum standard for Year 5, band 5 is the minimum standard for Year 7, and band 6 is the minimum standard for Year 9.
NAPLAN Results 2022
On 31st October 2022, ACARA released the NAPLAN result for the year 2021-22 on its official website. To get access to the NAPLAN result 2022 you can click on the link, “NAPLAN Results 2022“.
Below are the critical insights on the 2022 NAPLAN Results.
Key Insights of NAPLAN Results 2022
The 2022 National Report has also been released based on the NAPLAN result 2022. This report offers data that is comparable across the country on the 2022 national and state/territory. The report provides insights year-wise, section-wise, gender-wise, state-wise, and based on language background. Schools, governments, and education authorities use the data and information provided by the National Assessment Program to make decisions concerning the education of young Australians.
Over the long term since 2008, the national results show:
- Approximately 4.7 million students sat for the NAPLAN 2022 test.
- NAPLAN was fully administered online for the first time in 2022. The transition from traditional paper-based testing to online adaptive testing took place from 2018 to 2021.
- From 2021 to 2022, national results were largely consistent, apart from a slight decline in performance in Year 5 numeracy and Year 9 spelling.
- The report provides insights year-wise, section-wise, gender-wise, state-wise, and based on language background.
- The spelling scores for Years 3, 5, and 7 are continuously improving.
- Results for Years 3 and 5 show a consistently increasing trend in reading.
- There has been an improvement in numeracy in Year 5 results.
- The scores for grammar and punctuation are consistent across all years.
- There were 48 test incidents reported. Test incidents can include cheating, security breaches, and other general breaches.
- While a steadily progressive trend is still there in Year 7, the average numeracy achievement of female students, which had been rising in previous assessment years, has started to flatten.
- Results for indigenous kids show a rising overall trend but a flattening trend in Year 3 spelling and a rising trend in Year 9 spelling.
- Non-Indigenous pupils’ performance in Year 3 grammar and punctuation has increased gradually, while their grades in Year 7 numeracy indicate a steadily upward trend.
- LBOTE(Language background other than English) students showed a steadily positive trend in Years 3 and 7 numeracy; however, the achievement of LBOTE students in Year 9 numeracy decreased in recent assessment years after an increase in early NAPLAN years.
- There is a steadily positive trend in Years 7 and 9 reading for LBOTE students.
To read more about the results click on the link- “National Report on 2022”
Results for 2022 Compared With 2021
At a national level, when compared with 2021:
- Year 5 students declined in numeracy.
- Year 9 students declined in spelling.
By student background, when compared with 2021:
–Gender
- Female students declined in Year 5 numeracy and Year 9 spelling.
- Male students declined in Years 5, 7, and 9 numeracy, and Year 5 grammar and punctuation.
–Indigeneity
- Year 9 Indigenous students’ results showed a substantial improvement in writing.
- Year 7 Indigenous students’ results improved in grammar and punctuation.
- Year 7 Indigenous students’ results declined in spelling.
–Language background other than English (LBOTE)
- Year 5 numeracy results declined for LBOTE students.
- Year 9 writing results improved for LBOTE students.
- Years 5, 7, and 9 students who only speak English at home declined in numeracy.
- Year 9 students who only speak English at home declined in spelling.
- Year 5 students who only speak English at home declined in grammar and punctuation.
NAPLAN Results QLD
If you are looking for the NAPLAN results for Queensland, look no further, as Wiingy has collected the same. Here are the NAPLAN results for Queensland students of 2022. The data has been taken from the official ACARA website and the National Report for 2022 released by National Assessment Programme.
Click “NAPLAN Result 2022” to go to the official website of ACARA to view the result directory.
The important insights into the results are provided below:
- Queensland Reading
- Queensland Numeracy
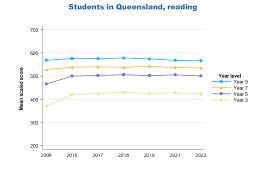
Queensland Reading
The Graph shows the mean scaled score from 2008 to 2022 for Years 3, 5, 7, and 9. The table below the graph shows the scores of the students of Queensland in the Reading section.
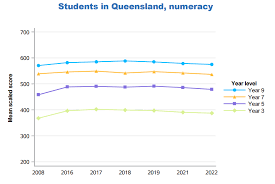
Queensland Numeracy
The Graph shows the mean scaled score from 2008 to 2022 for Years 3, 5, 7, and 9.
NAPLAN Results Victoria
If you are looking for the NAPLAN results for Victoria, look no further, as Wiingy has collected the same. Here are the NAPLAN results for Victoria students of 2022. The data has been taken from the official ACARA website and the National Report for 2022 released by National Assessment Programme.
Click “NAPLAN Result 2022” to go to the official website of ACARA to view the result directory.
The important insights into the results are provided below:
- Victoria Reading
- Victoria Numeracy
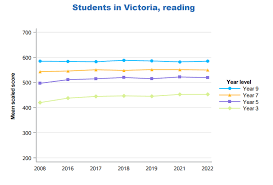
Victoria Reading
The Graph shows the mean scaled score from 2008 to 2022 for Years 3, 5, 7, and 9.
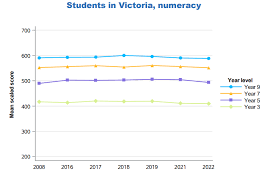
Victoria Numeracy
The Graph shows the mean scaled score from 2008 to 2022 for Years 3, 5, 7, and 9.
NAPLAN Result NSW
If you are looking for the NAPLAN results for New South Wales, look no further, as Wiingy has collected the same. Here are the NAPLAN results for New South Wales students of 2022. The data has been taken from the official ACARA website and the National Report for 2022 released by National Assessment Programme.
Click “NAPLAN Result 2022” to go to the official website of ACARA to view the result directory.
The important insights into the results are provided below:
- New South Wales Writing
- New South Wales Numeracy
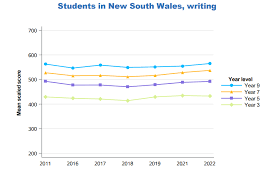
New South Wales Writing
The Graph shows the mean scaled score from 2008 to 2022 for Years 3, 5, 7, and 9.
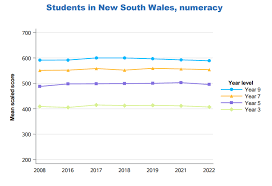
New South Wales Numeracy
The Graph shows the mean scaled score from 2008 to 2022 for Years 3, 5, 7, and 9.
Conclusion
NAPLAN results are publicly reported each year. The reports contain information about what was assessed in each of the tests, and the knowledge and skills students demonstrated in the tests.
Data files with results for individual students, schools, jurisdictions and the nation is also available for use by jurisdictions, non-government school sectors, and schools. NAPLAN results are a key resource to compare the performances of states and territories.
NAPLAN results do not pass or fail results, NAPLAN results assess key aspects of literacy and numeracy in the Australian Curriculum.
To know more about the NAPLAN exam visit our detailed post – “NAPLAN – The definitive guide for parents & students“.
FAQs
Have NAPLAN 2022 results been released?
Yes. On October 31, the Australian Curriculum, Assessment and Reporting Authority (ACARA) released its report on the national NAPLAN results.
How to find my NAPLAN results?
You should get in touch with the school where your child took the test if you want a copy of their NAPLAN report.
Are NAPLAN results given to parents?
State and territory test administration agencies give reports on each student’s performance to all students as well as their parents and caregivers.
What is a good NAPLAN score for Year 5 2022?
If your child’s results for Grade 5 are in Band 4, they only meet the minimum national standard (typically a grade below “C”). Bands 5 to 7 represent the average and what most students receive (typically a grade between “C” and “B” in schools), and Bands 8 and higher are above average (typically a “A” grade).
Does NAPLAN affect Australian Tertiary Admission Rank (ATAR)?
Students in New South Wales Year 9 who perform below a certain level on their NAPLAN exams will no longer be in danger of not passing their HSC.
Is NAPLAN an IQ test?
The SAT and NAPLAN assessments are fundamentally IQ tests, despite the fact that they are no longer classified as such. They assess the candidate’s verbal (literacy) and mathematical (numeracy) IQ, and the equally weighted total of the two yields a very accurate indicator of overall IQ.
Is ATAR 87 good?
Yes. Eighty is the minimum ATAR for entry into most programs at the Australian National University.
What’s the best band in NAPLAN?
To track student performance on the assessments, the NAPLAN assessment scale is divided into 10 bands. The bands range from 1 to 10, with 10 being the highest band.
Does it matter if you fail NAPLAN?
Students should just do their best because NAPLAN isn’t that kind of test and they can’t fail it. The detailed, continuing assessments of each student’s performance that instructors do about them do not get replaced by NAPLAN examinations; they are merely one part of each school’s assessment and reporting process.
When were NAPLAN school results in 2022 declared?
NAPLAN results are provided to schools from August to September. On October 31, the Australian Curriculum, Assessment and Reporting Authority (ACARA) released its report on the national NAPLAN results 2022.
What are NAPLAN Victoria’s best-performing schools?
The two top spots are taken by private schools, Presbyterian Ladies’ College and Huntingtower School.
How to check NAPLAN results 2022?
You should get in touch with the school where your child took the test if you want a copy of their NAPLAN report. The test administration authority for the state or territory in which the school is located may provide a copy of the report upon request if the school does not already have one.
What NAPLAN results mean?
NAPLAN result is not the intelligence or IQ test. NAPLAN is just a snapshot of the reading, writing, and numeracy skill of the student.
Written by by
Shefali SundramReviewed by by
Review BoardShare article on

