Statistics tutor in Canada
Statistics turns data into decisions, and an online statistics tutor helps it all make sense. Lessons cover averages, probability, distributions, and tests, building on Ontario's MDM4U and first-year university courses. It matters across science, business, psychology, and the booming field of data science. Help comes from home, in real time, whenever a concept or a calculation stops adding up.
Free Trial
15-days refund
Free tutor swap
No cancel fee
Summary
Podcast

Statistics taught in Canadian tutor classes
Statistics explored in Montreal, Toronto, Mississauga
Emmanuel taught 7 months ago
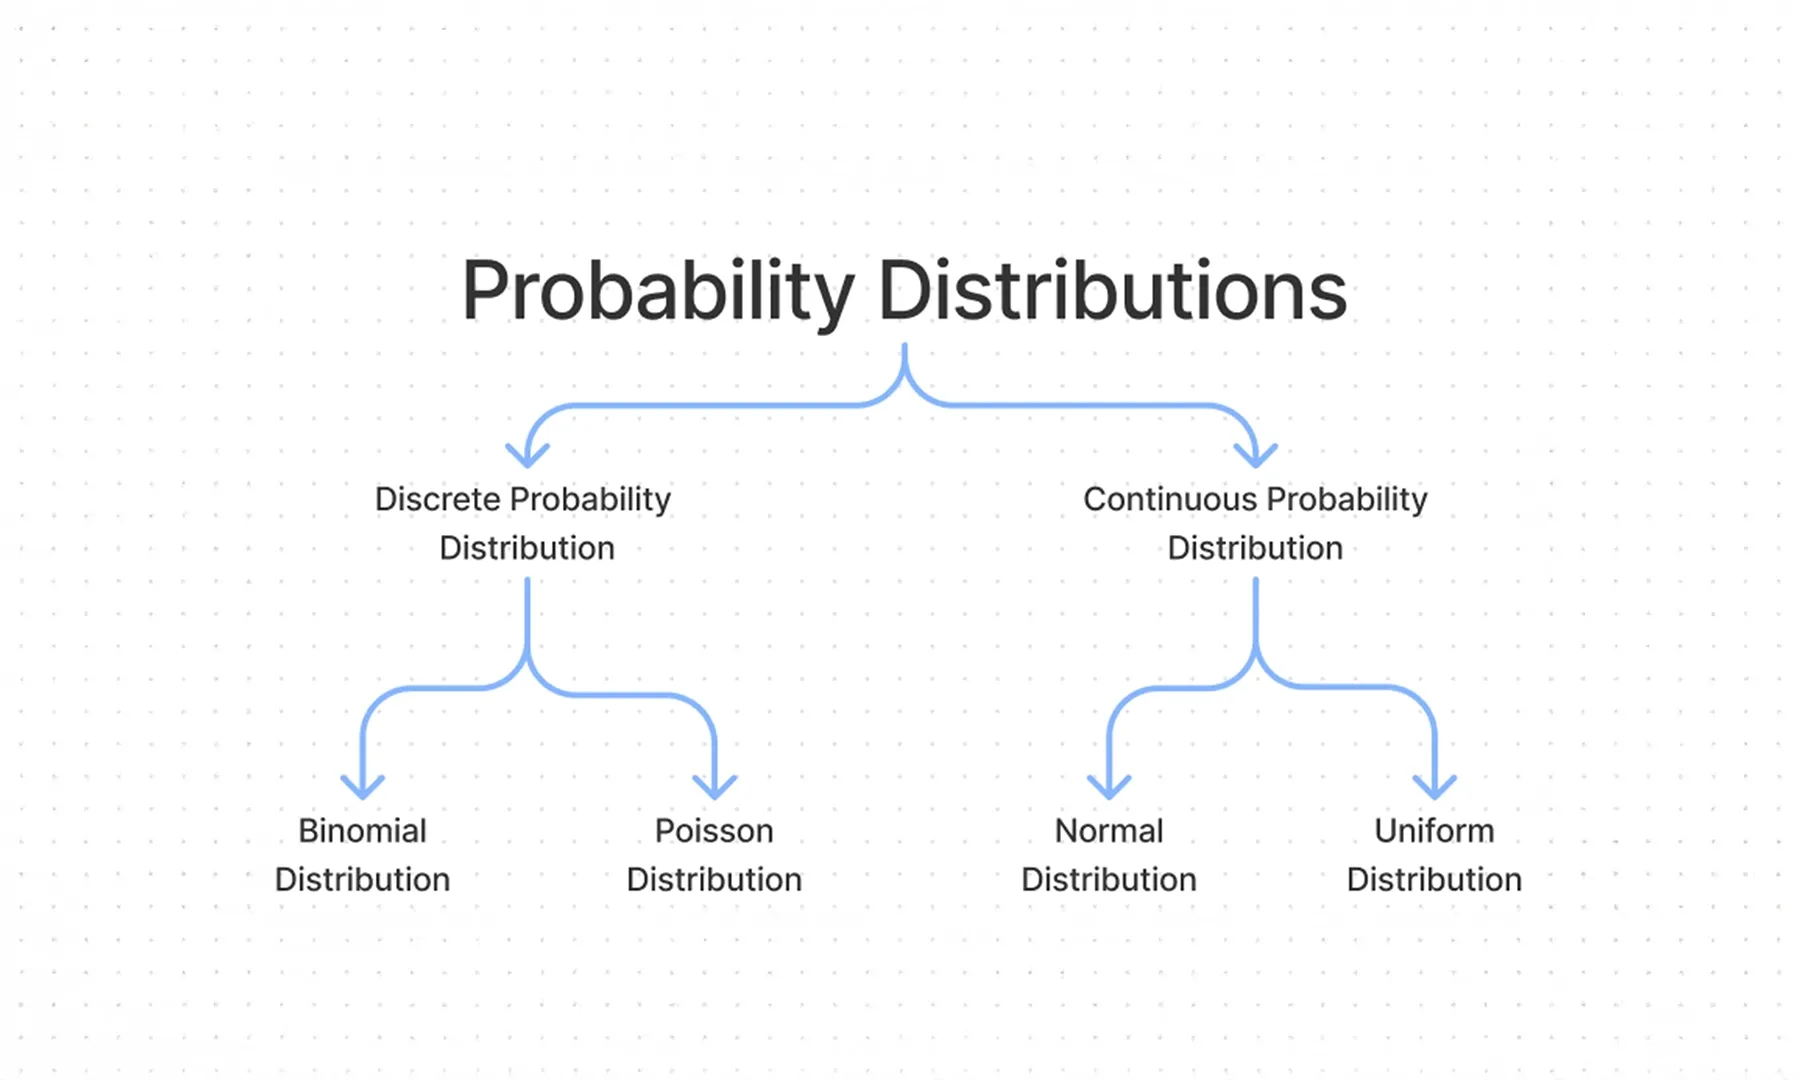
The session reviewed various statistical distributions and hypothesis testing. The student practiced identifying appropriate formulas and applying them to different problem types, focusing on binomial, geometric, normal, and exponential distributions. The session concluded with practice on hypothesis testing, including setting up null and alternative hypotheses, calculating test statistics, and interpreting results.
Binomial Distribution
Geometric Distribution
Normal Distribution
Exponential Distribution
Hypothesis Testing
T-Distribution vs. Z-Distribution
Emmanuel taught 8 months ago
The Student and Tutor reviewed regression analysis, focusing on error correction in a previously completed problem set. The session also included strategies for creating an effective formula sheet for the upcoming exam and a discussion on prioritizing key topics for focused study. The Student was assigned to rework the regression problem, verifying the solution against the answer key.
Regression Analysis
Correlation
Coefficient of Determination (R²)
Formula Sheet Optimization
Statistical Significance
Emmanuel taught 8 months ago
The Student and Tutor reviewed correlation and regression concepts, practiced interpreting t-statistics for hypothesis testing, and worked on regression parameter calculations. The session included a discussion of strategies for efficient problem-solving, emphasizing the importance of table structure and accurate formula usage. The Student was assigned additional practice problems focusing on regression analysis and interpreting the coefficient of determination, to be reviewed in the next session.
Summation Notation Importance
Parentheses in Mathematical Expressions
Interpreting T-Statistic Significance
Statistically Significant Correlation
Linear Regression Model
Coefficient of Determination (r²)
Solving for Variables in Regression
Garimidi taught 8 months ago
The student and tutor worked through practice problems related to hypothesis testing and confidence intervals for proportions. They reviewed p-values, error types (Type I and Type II), and assumptions for statistical tests. The session concluded with formula-based calculations for sample size and combined mean/standard deviation.
Two Proportion Hypothesis Testing
Pooled Sample Proportion
Interpreting P-values
Confidence Intervals and Hypothesis Testing
Type I and Type II Errors
Sample Size Calculations
Combined Mean and Standard Deviation
Emmanuel taught 8 months ago
The session involved practice problems focused on correlation coefficients and t-statistics. The student worked on a new problem set, computing means, standard deviations, and correlation coefficients. Homework was assigned to complete the problem set, and it will be reviewed in the next session.
Mean Calculation and Interpretation
Standard Deviation: Measuring Data Spread
Pearson Correlation Coefficient (r): Assessing Relationships
T-Statistic: Hypothesis Testing
Critical Values and Statistical Significance
Garimidi taught 8 months ago
The Student and Tutor reviewed hypothesis testing, Z-test statistics, Type I and Type II errors, and confidence intervals. The Student practiced problems related to these concepts. The Tutor assigned practice problems for the Student to complete before the next session.
Hypothesis Testing: Null and Alternate Hypotheses
Z-Test Statistic
P-value and Significance Level (α)
Type I and Type II Errors
Power of a Test
Confidence Intervals
Statistics tutoring with key academic specialities across Canada


Statistics tutoring snapshots from Canadian classes

Total Statistics tutors
358 Statistics tutors available

Experienced Statistics tutors
Average 12 years of teaching experience

Statistics Tutor Qualifications
76% hold a Master’s or PhD degree
Why statistics in Canada feels harder than it looks
A subject that hides its complexity
On the surface, statistics sounds like it should be simple. After all, it’s just about analyzing data, something most students already interact with every day. But the way statistics is taught in Canada often tells a different story.
In high schools across Ontario and Alberta, students might encounter statistics as a short unit inside Grade 12 Data Management or Math 30-2. Topics like standard deviation, normal distributions, and probability are introduced quickly, often without deep application. By the time students reach university and face courses like PSYC2020 at York, ECON 222 at UBC, or BIOL 206 at McMaster, they’re expected to understand experimental design, statistical significance, and tests of inference, sometimes without ever having worked with real datasets before.
Not quite math, not quite theory
The gap is obvious. Statistics is not just a math course. It blends logic, uncertainty, and interpretation. You’re not just solving for x. You’re justifying why the data matters, when the results are significant, and what conclusions can actually be drawn. This feels especially foreign to students used to solving for exact answers. In statistics, there’s a confidence level, a margin of error, and always some uncertainty.
Canadian students also face an extra challenge: statistics is embedded across disciplines. A student in Montreal studying psychology must learn ANOVA and t-tests for lab reports. A health sciences major in Winnipeg uses chi-square tests in SPSS to analyze clinical survey data. Business students in Toronto model consumer behavior using regression in Excel or R. And in social sciences programs, students are expected to interpret data ethically, clearly, and defensibly, often in written assignments rather than equations.
Where tutoring meets real-world expectations
Tutoring becomes more than homework help. It fills the space between memorizing a formula and understanding what that formula reveals. It helps students prepare not just for exams, but for interpreting data in policy briefs, research theses, and applied projects. The value of a tutor lies in bridging stats theory with real Canadian academic expectations, the kind that show up in capstone projects, lab work, and even graduate entrance exams.


