
Nikita Dadlani
Excited to teach Mathematics and Statistics. My strong skills are Statistics and Probability.





Show all photos
Nikita Dadlani
Masters degree
/ 55 min
Nikita - Know your tutor
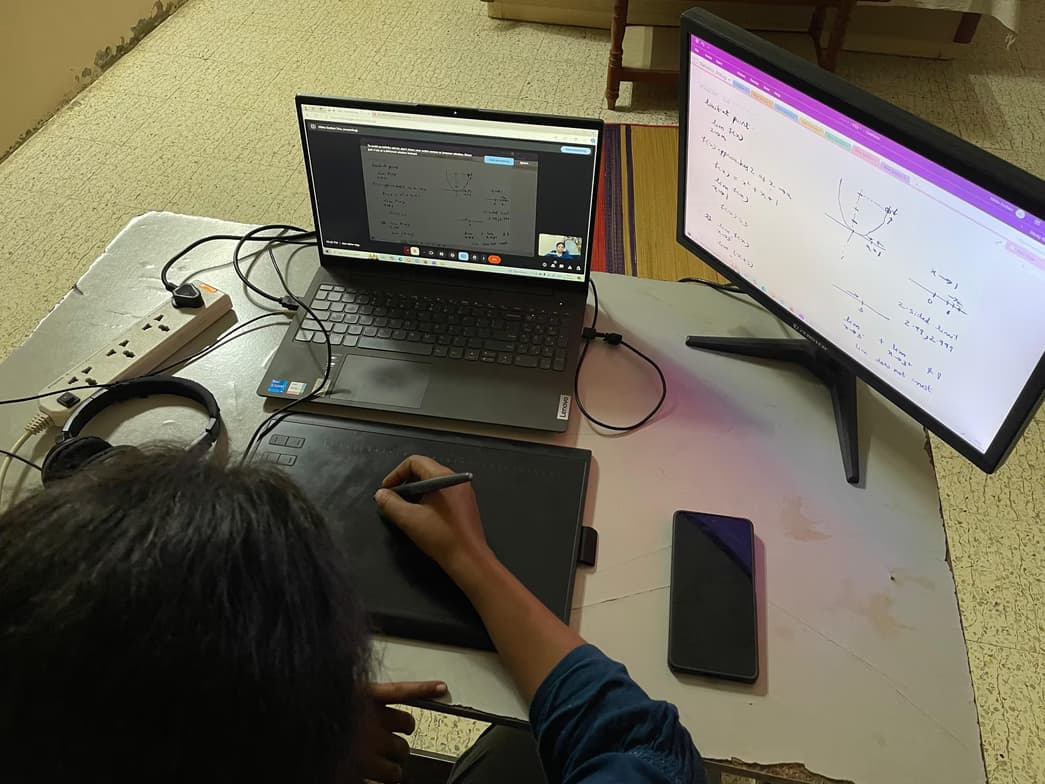
Hello, my name is Nikita Dadlani. I teach Mathematics and Statistics and have around 8+ years of experience in this. I personally like statistics and probability as my teaching subjects. I can teach it from beginner to advanced level. And other subjects like linear algebra and calculus I can teach up to high school level. I use pen tab for teaching mathematics and statistics concept. Sometimes I also use excel for showing quick calculations, and most importantly descriptive statistics and graphs in it. I prefer to use practical examples to teach the concepts to make it more relatable and easy to grab. I believe clearly logic and concepts is very important in mathematics and it's as important as practice is important in these subjects. If logic is clear, one can solve almost all types of problems related to that concept. Tackling problem, tricks and hacks are required and important in mathematics and statistics. I teach students to break complex problems into simpler ones. I try my best to let students be confident and not scared of logics in these subjects. I try to solve the doubts of students and make aure that he/she has understood the problem clearly. I motivate students to ask doubts and make the learning as well as teaching more interactive and interesting. Thank you!
Meet Nikita
Specialities of your tutor

Mental Math

Practice Tests

Practice Drills

Problem Solving

Math Tricks and Hacks

Homework help

Exam Simulation
 CoTutor
AI modules
Summary
Podcast
Quiz
Learnings
Flashcard
Spotlight
Zero Risk Guaranteed
15-days refund
Free tutor swap
No cancel fee
1-yr validity
24/7 support
Student types for classes

Anxiety or Stress Disorders

Learning Disabilities

Home schooled

Elementary School students
Middle School students
High School students

Improved problem-solving skills
90% of students report faster and more efficient problem-solving.

Test-ready in weeks
85% of students feel fully prepared for their upcoming exams.

Rated 5 stars for personal growth
Learners report improved flexibility, strength, and wellness.

Trusted by 90% of parents
Parents see their child’s grades improving within a few months.
Highly recommended for results
Parents consistently recommend the tutor for math success.

Increased mind-body awareness
85% of learners see better body awareness and posture

Focus on real-world applications
85% of students find math concepts more relevant to real-life problems.

Regular progress check-ins
90% of students get regular updates on their math performance.

Personalized guidance for progress
80% of learners see quicker progress with tailored sessions.
Nikita also teaches

Algebra
Algebra 2
Arithmetic
Calculus
Calculus 2
Calculus 3

Mathematics concepts taught by Nikita
Student and Tutor worked on resolving Excel print preview issues, focusing on correctly displaying borders and organizing content across pages. They practiced adjusting page layout settings, managing page breaks for tables and charts, and formatting chart elements for improved readability. The next session is scheduled to continue this work.
Optimizing Print Layout for Excel Tables
Strategic Page Break Management
Enhancing Chart Presentation and Layout
Ensuring Data Accuracy and Pivot Table Refresh
The Student and Tutor worked on refining an Excel workbook by correcting formula inconsistencies related to commission calculations and updating pivot tables. They also addressed print preview formatting challenges, attempting to improve readability, but encountered persistent issues with borders not appearing in the preview. A follow-up session was planned to resolve these remaining formatting concerns.
Correcting Formula Inconsistencies in Excel
Managing and Refreshing Pivot Tables
Optimizing Print Layout and Readability in Excel
Differentiating Historical vs. Current Year Data Management
The Student and Tutor worked on updating and verifying real estate commission data in a spreadsheet for the year 2026. They focused on cross-referencing payment reports with the existing spreadsheet, correcting discrepancies, ensuring formulas and pivot tables reflected accurate figures, and discussed the importance of refreshing data. The Student plans to continue updating and verifying data against trade sheets, with the next session addressing further discrepancies and automating total calculations.
Accurate Data Adjustment for Commissions
Managing Excel Pivot Tables
Ensuring Accurate Print Layouts
Resolving Financial Data Discrepancies
Prioritizing Data Integrity
The Student and Tutor worked on refining an Excel workbook designed for tracking real estate commissions. They focused on updating and verifying commission data, refreshing pivot tables and charts to reflect the changes, and adjusting page breaks to optimize the print layout. The next session will involve integrating new commission data once it becomes available.
Optimizing Print Layouts with Page Breaks
Data Verification & Reconciliation with External Sources
Dynamic Data Visualization: Refreshing Pivot Tables and Charts
Excel Data Entry & Formula Management
The student and tutor worked on automating Excel formulas for commission tracking. They focused on updating `SUMIF` functions and cell ranges within Excel tables to ensure dynamic calculations for agent commissions and total payouts, with plans to verify accuracy once brokerage data is received.
Understanding Collapsed Deals in Sales Tracking
Spreadsheet Table Designations and Row Numbering
Data Validation and Accuracy Checks
Formula Automation in Spreadsheets
The student and tutor focused on implementing and troubleshooting Excel formulas to automate deal counts and total commission calculations across multiple tables. They practiced applying dynamic formulas, correcting syntax errors, and understanding the difference between automated and manual data entry for financial reporting.
Dynamic Formula Referencing
Manual vs. Automated Data Entry
Handling Column Name Inconsistencies in Formulas
Automating Table Calculations
Teaching tools used by tutor

Quizzes

Math Games

Presentations

Assessment

Solvers & Calculators

Digital whiteboard

Practice worksheets

Math tutors on Wiingy are vetted for quality
Every tutor is interviewed and selected for subject expertise and teaching skill.