Vishal Zawar
Excel Training by Finance Expert | Boost Skills & Productivity | Learn Data Analysis, Dashboards & Automation
Loading...


Show all photos
Vishal Zawar
Masters degree
Enroll after the free trial
Each lesson is 55 min
50 lessons
20% off
/ lesson
30 lessons
15% off
/ lesson
20 lessons
10% off
/ lesson
10 lessons
5% off
/ lesson
5 lessons
-
/ lesson
1 lessons
-
/ lesson
About your data science tutor
With a strong foundation in finance, analytics, and professional training, my teaching approach is designed to bridge the gap between theoretical knowledge and practical application—especially in tools like Microsoft Excel, which remains one of the most powerful and widely used platforms in the professional world. Over the years, I have developed a teaching style that is highly interactive, application-oriented, and tailored to the diverse learning needs of students from commerce, management, and technical backgrounds. My philosophy of teaching Excel goes beyond formulas and functions. I believe Excel is not just a software—it is a decision-making tool. Whether a student is a beginner trying to understand basic calculations or an advanced learner aiming to build financial models or dashboards, my goal is to help them think analytically and solve real-world problems efficiently. I focus on developing clarity of concepts first and then gradually moving towards complexity, ensuring that every student builds a strong and confident foundation. One of the key highlights of my teaching style is simplicity. I break down complex Excel concepts into easy-to-understand steps using real-life examples. For instance, instead of just explaining functions like VLOOKUP, INDEX-MATCH, or Pivot Tables in isolation, I connect them to business scenarios such as sales analysis, inventory management, or financial reporting. This makes learning more relatable and helps students understand not just “how” but also “why” a particular function is used. Together, we work towards transforming knowledge into skills and skills into success.
Data Science tutor skills
Data visualization
Predictive modeling
Case Studies
Learner types for data science class
Data Science for intermediate
Data Science for beginners
Data Science for advanced
Data Science for adults
Expert in debugging code
Breaks down coding issues into manageable steps.
Rated highly for assignment help
Clear, step-by-step support for assignments.
Interactive debugging sessions
Students debug and improve their own code in real-time.
Flexible Scheduling
Allows 1h early scheduling
Allows 1h early rescheduling
Can wait for 20 mins after joining

10 day Refund
Free Tutor Swap

Data Science concepts taught by Vishal
The tutor instructed the student on how to use the Wingi platform's chat feature to upload academic documents. They practiced navigating the platform, logging in, and finding the chat functionality. The session also included troubleshooting document upload issues, with a plan to share screens for further assistance.
Document Sharing via Chat
Accessing the Learning Platform (Wingi)
Student Dashboard Navigation
Troubleshooting File Sharing Issues
The Tutor and Student worked on financial statement analysis, specifically focusing on the income statement and balance sheet. They practiced calculating and interpreting absolute and percentage changes for various financial metrics, with a plan to create a cash flow statement in the next session.
Balance Sheet Analysis
Depreciation and Amortization
Interpreting Financial Statement Details (Notes to Accounts)
Cash Flow Statement
The Tutor guided the Student through an Excel session focused on financial statement analysis, specifically comparative analysis. They practiced calculating absolute and percentage changes between two financial years using Excel and began interpreting the results, covering concepts like revenue, COGS, and operating income.
Comparative Analysis
Absolute vs. Percentage Change
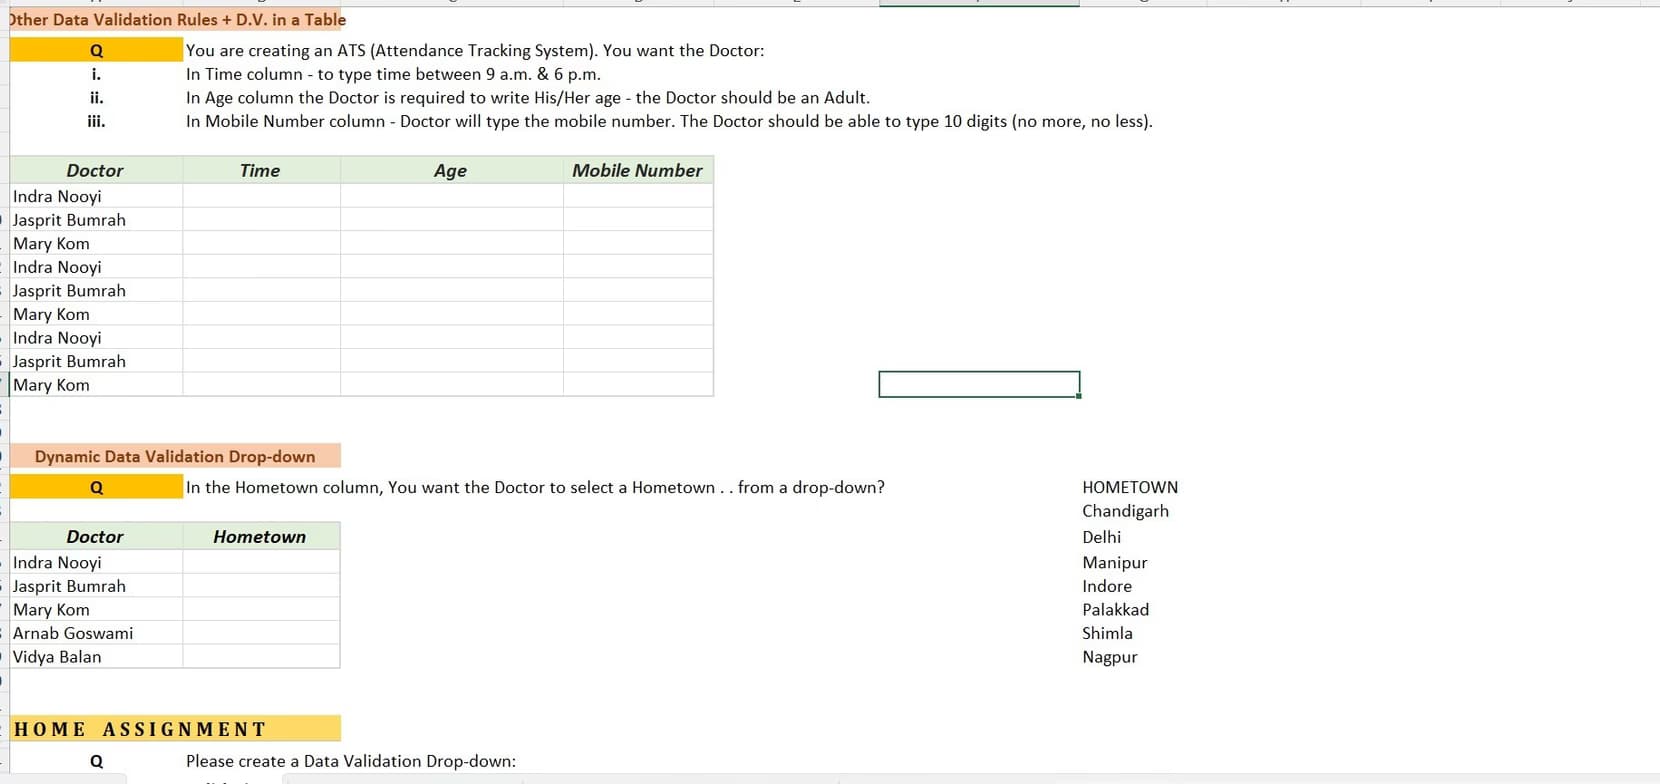
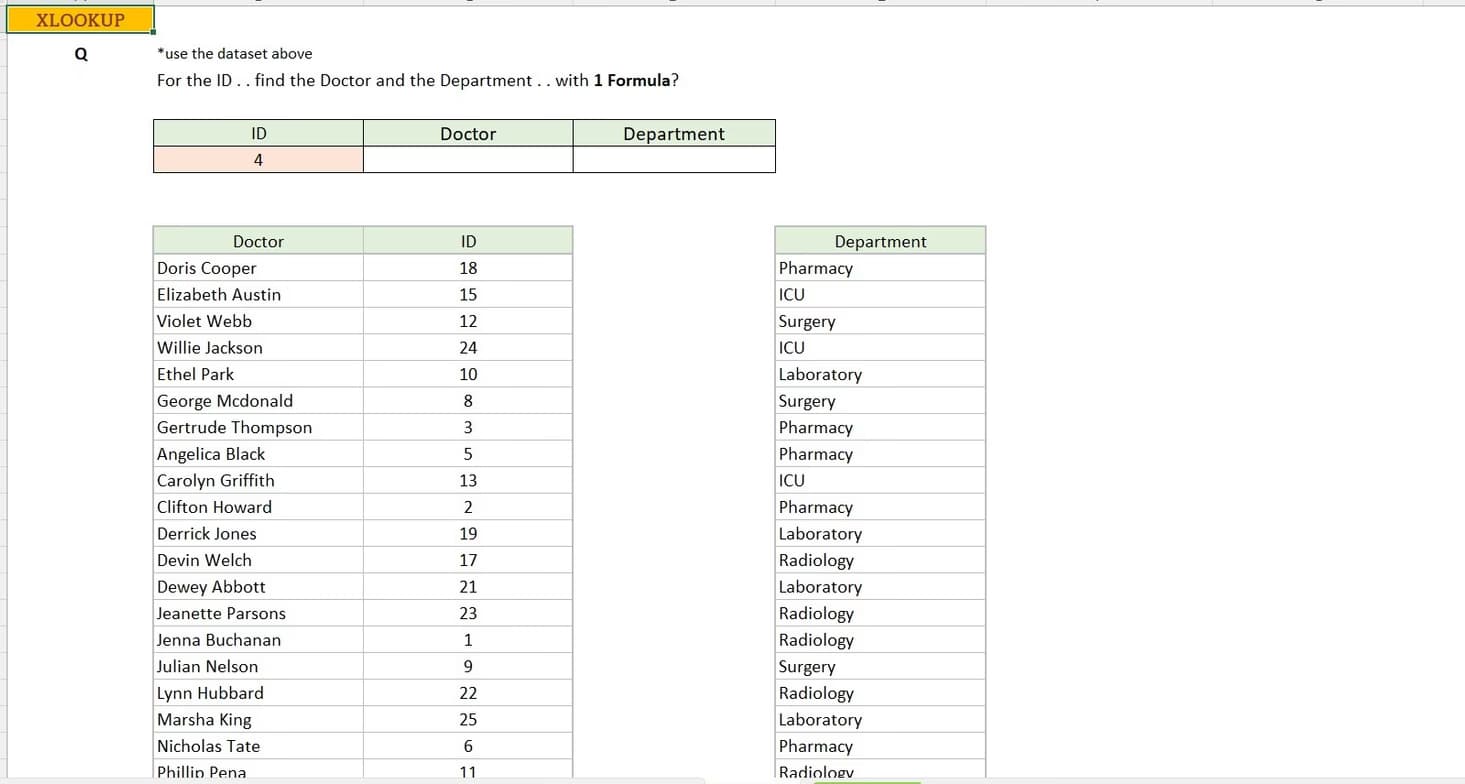
Excel for Financial Analysis
Interpreting Financial Statements
Depreciation vs. Impairment
Teaching tools used by data science tutor
Streamlit
Google Colab
Jupyter Notebook

Data Science tutors on Wiingy are vetted for quality
Every tutor is interviewed and selected for subject expertise and teaching skill.