Neha Trivedi
Data Science, Excel, Coding & Robotics Tutor | 3+ Years Experience| Helping Students Master Tech Skills


Show all photos
Neha Trivedi
Bachelors degree
/ 55 min
About your data science tutor
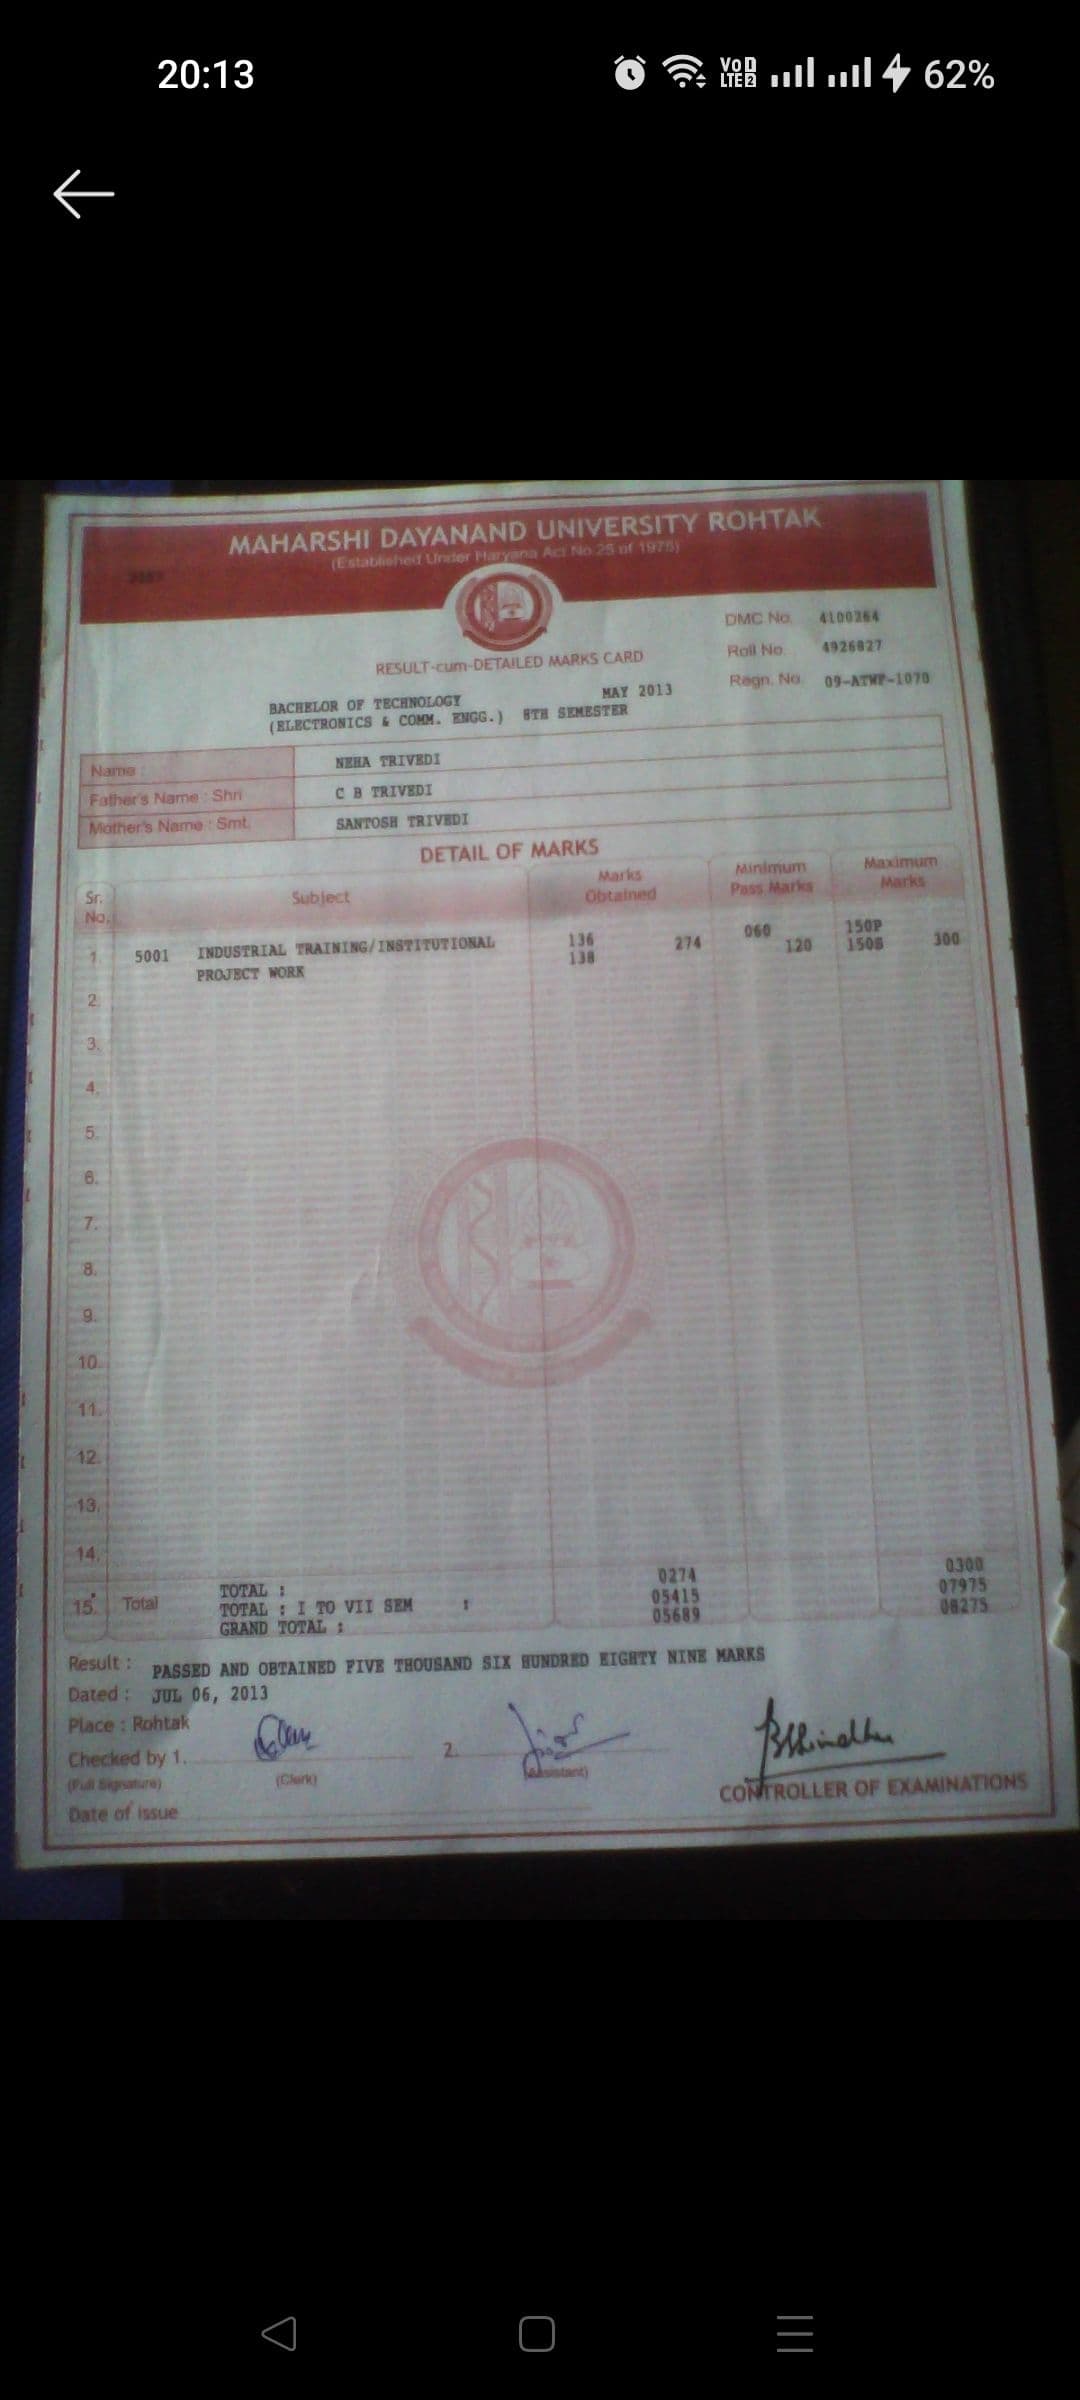
I am Neha Trivedi from Faridabad, a B.Tech graduate in Electronics and Communication with over three years of experience in online education. I specialize in teaching Data Science fundamentals, Excel, Coding, and Robotics, helping students build strong analytical, logical, and technical skills required in today’s rapidly evolving digital world. My goal as an educator is to make technology understandable, practical, and exciting for students so they can confidently apply their knowledge in real-world situations. Throughout my teaching journey, I have worked with well-known edtech platforms such as BrightChamps, TutorCare, and GyaanWorld, where I conducted engaging online sessions for students from different age groups and learning backgrounds. This experience has allowed me to interact with a diverse group of learners and understand how different students grasp concepts. It has also strengthened my ability to design lessons that are interactive, structured, and adapted to each learner’s pace. I have experience teaching students from various curricula including CBSE, IB, IGCSE, and ICSE. Working with international and national curricula has helped me understand the different learning approaches used around the world. I focus on ensuring that students not only complete their coursework but a concept understanding.
Meet Neha
Neha graduated from Maharishi Dayanand University
Data Science tutor skills
Statistical analysis
Business intelligence
Assignment help
Data visualization
Case Studies
AI modules
Summary
Podcast
Quiz
Learnings
Flashcard
Spotlight
Zero Risk Guaranteed
15-days refund
Free tutor swap
No cancel fee
1-yr validity
24/7 support
Learner types for data science class
Data Science for intermediate
Data Science for kids
Data Science for beginners
Your data science tutor also teaches
Data Analysis
Excel

Data Science concepts taught by Neha
The Tutor and Student practiced applications of derivatives, focusing on implicit differentiation and solving related rates problems. They worked through examples involving spheres, ladders, and conical tanks, emphasizing the process of setting up equations, differentiating with respect to time, and solving for unknown rates. The Tutor provided guidance and corrected errors throughout the problem-solving process.
Implicit Differentiation with Respect to a Third Variable
Related Rates in Geometric Problems
Pythagorean Theorem in Related Rates
Volume of a Cone and Related Rates
The session provided an in-depth tutorial on implicit differentiation, covering its application in finding derivatives and tangent lines for implicitly defined functions. The student practiced solving complex equations using product and chain rules, with a focus on algebraic manipulation to isolate the desired derivative. The tutor planned to continue with similar problems in future sessions.
Implicit Differentiation
Product Rule in Implicit Differentiation
Finding Tangent Lines
Simplification in Implicit Differentiation
The Student and Tutor reviewed and practiced various differentiation techniques in calculus, including product rule, quotient rule, chain rule, and differentiation of inverse trigonometric and hyperbolic functions. They worked through numerous examples to solidify understanding and the Student practiced applying these rules to complex expressions. The next steps will involve continued practice with these differentiation methods.
Chain Rule
Product Rule
Quotient Rule
Hyperbolic Functions
Recognizing Derivative Rules
This introductory Microsoft Word session covered essential formatting and document creation tools. The tutor demonstrated how to open, save, format text with headings, styles, and alignment, insert tables and images, and apply page borders and colors. The student practiced these elements, and a future lesson plan was outlined, including templates, charts, headers/footers, and file sharing.
Shapes and Text Boxes
Document Enhancements
Inserting and Manipulating Objects
Text Formatting Basics
The Tutor and Student reviewed and practiced derivative rules including the product and quotient rules, and then moved on to trigonometric limits and their applications. They also covered derivatives of exponential, logarithmic, and inverse trigonometric functions, with the student working through examples and applying learned formulas. The next session will continue with inverse trigonometric functions and related concepts.
Trigonometric Limits
Derivatives of Exponential and Logarithmic Functions
Derivatives of Inverse Trigonometric Functions
Quotient Rule
Product Rule
The student and tutor worked through various integration problems in calculus, practicing substitution techniques for trigonometric, exponential, and rational functions. They also touched upon basic differential equations and reviewed standard formulas for inverse trigonometric functions, with the student expected to practice more problems independently.
Differential Equations Basics
Standard Integral Formulas
Integration of Rational Functions
U-Substitution in Integration
Teaching tools used by data science tutor
RStudio
Jupyter Notebook

Data Science tutors on Wiingy are vetted for quality
Every tutor is interviewed and selected for subject expertise and teaching skill.